Natural Frequency and Resonance
Natural frequency is the frequency at which a system naturally vibrates once it has been set into motion. In other words, natural frequency is the number of times a system will oscillate (move back and forth) between its original position and its displaced position, if there is no outside interference. For example, consider a simple beam fixed at one end and having a mass attached to its free end, as shown in Figure 1. If the beam tip is pulled downward, then released, the beam will oscillate at its natural frequency.

Figure 1
If the tip mass (m) weighs much more than the beam to which it is attached, the natural frequency can be calculated using the simple formula

Where k is the beam stiffness in pounds/inch. The following experiment further illustrates these concepts.
Experiments
Experiment 1
Supplies:
- Flexible lightweight fishing rod or other flexible rod. It is very important that the rod be highly flexible. A driveway reflector which can be purchased at a hardware store, works very well (Fig.1)
- Several objects of various weights that can be attached to the rod, such as a tennis ball, heavy fishing sinkers, heavy bolts or nuts, etc. These objects should weigh more than the rod to provide the most successful experiments. A driveway reflector as shown in Figures 1 and 2 provides a convenient location for attaching weights
- Table to which the rod can be attached.
- C-clamp for fastening the rod to the edge of the table.
- Stopwatch or clock with capability to indicate seconds.
Procedure:
- Clamp one end of the flexible rod to the table. Start without any tip weights. If a driveway reflector rod is used, the reflector should be removed initially.
- Pull the end of the rod downward, and then release it. If the rod moves slowly enough, count the number of oscillations (rod moving through complete cycle and back to release point) that occur in 30 seconds. The frequency is the number of oscillations divided by seconds.
- Now attach one of the weights to the free end of the rod, (such as the reflector tip mass in figure 1) and again pull it downward then release it. Count the number of oscillations and divide by the time to get frequency.
- Repeat step 3 for different tip weights. Plot frequency vs. tip weight. How does frequency change with the weight?
- Calculate the natural frequency and compare to the experiment described in steps 3 and 4 using the following procedure:
(a). Place a yardstick near the free end of the flexible rod, with one end of the yardstick resting on the floor. Note the location of the end of the rod and mark it on the yardstick.
(b). Attach several different weights to the end of the rod and measure the distance (x) that the end of the rod moves downward (see Figure 2) for each weight. Graph weight versus displacement. The stiffness K is the slope of this graph (rise/run), units (lb/in).
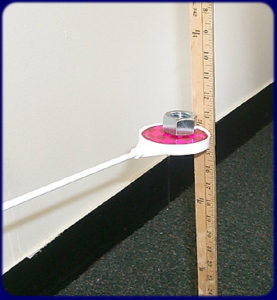
Figure 2
(c). Calculate the natural frequency using the formula
where stiffness k is measured in step (b) and m equals the tip weight divided by 386.1. How does this frequency compare to the measured natural frequency?
(d). Repeat steps (c) for different tip weights. Plot frequency vs. tip weight. How does this graph compare to the experiment results from step 4? More advanced students should overlay the two graphs.
Resonance
Resonance is the buildup of large vibration amplitude that occurs when a structure or an object is excited at its natural frequency. Resonance can be either desirable or undesirable. Acoustic resonance, a desirable resonance, occurs in many different musical instruments. It also occurs in auditoriums. Undesirable mechanical resonance can cause bridges to collapse, aircraft wings to break, and machinery to break or malfunction. For example, the Tacoma Narrows Bridge experienced large vibration amplitudes and catastrophic structural failure due to wind gusts.
Experiment 2: Resonance and Resonating Chambers (Tuning Fork with Soda Can
Supplies:
- Clean, empty soda can Tuning fork
- Directions:
Tap the fork and listen. Hold it over the opening of the can as shown in Figure 3 and listen.
Notice that the sound gets louder when it is held over the opening.
Figure 3
Explanation:
The can is a hollow container with an opening and is called a resonator. Its shape acts like a resonating chamber, like a drum or the bell of a tuba. The vibrating tuning fork held near the opening causes the can and the air in the can to vibrate. This is called resonance. The sound becomes intensified and amplified.
References:
Holiday and Resnick “Physics”
Click here for a printable version of these experiments Click Here